I wanted a meal planner that actually tracked macros and built grocery lists. So I built one. Tell Claude what's in the fridge — it figures out dinner.
01
AI Recipe Discovery
Integrated Anthropic Claude API for on-demand recipe generation. Three discovery modes — by ingredients on hand, by cuisine type, or open-ended inspiration — each returning structured dish ideas with descriptions, then linking to trusted recipe sources for import.
Claude APILLM IntegrationStructured Output
02
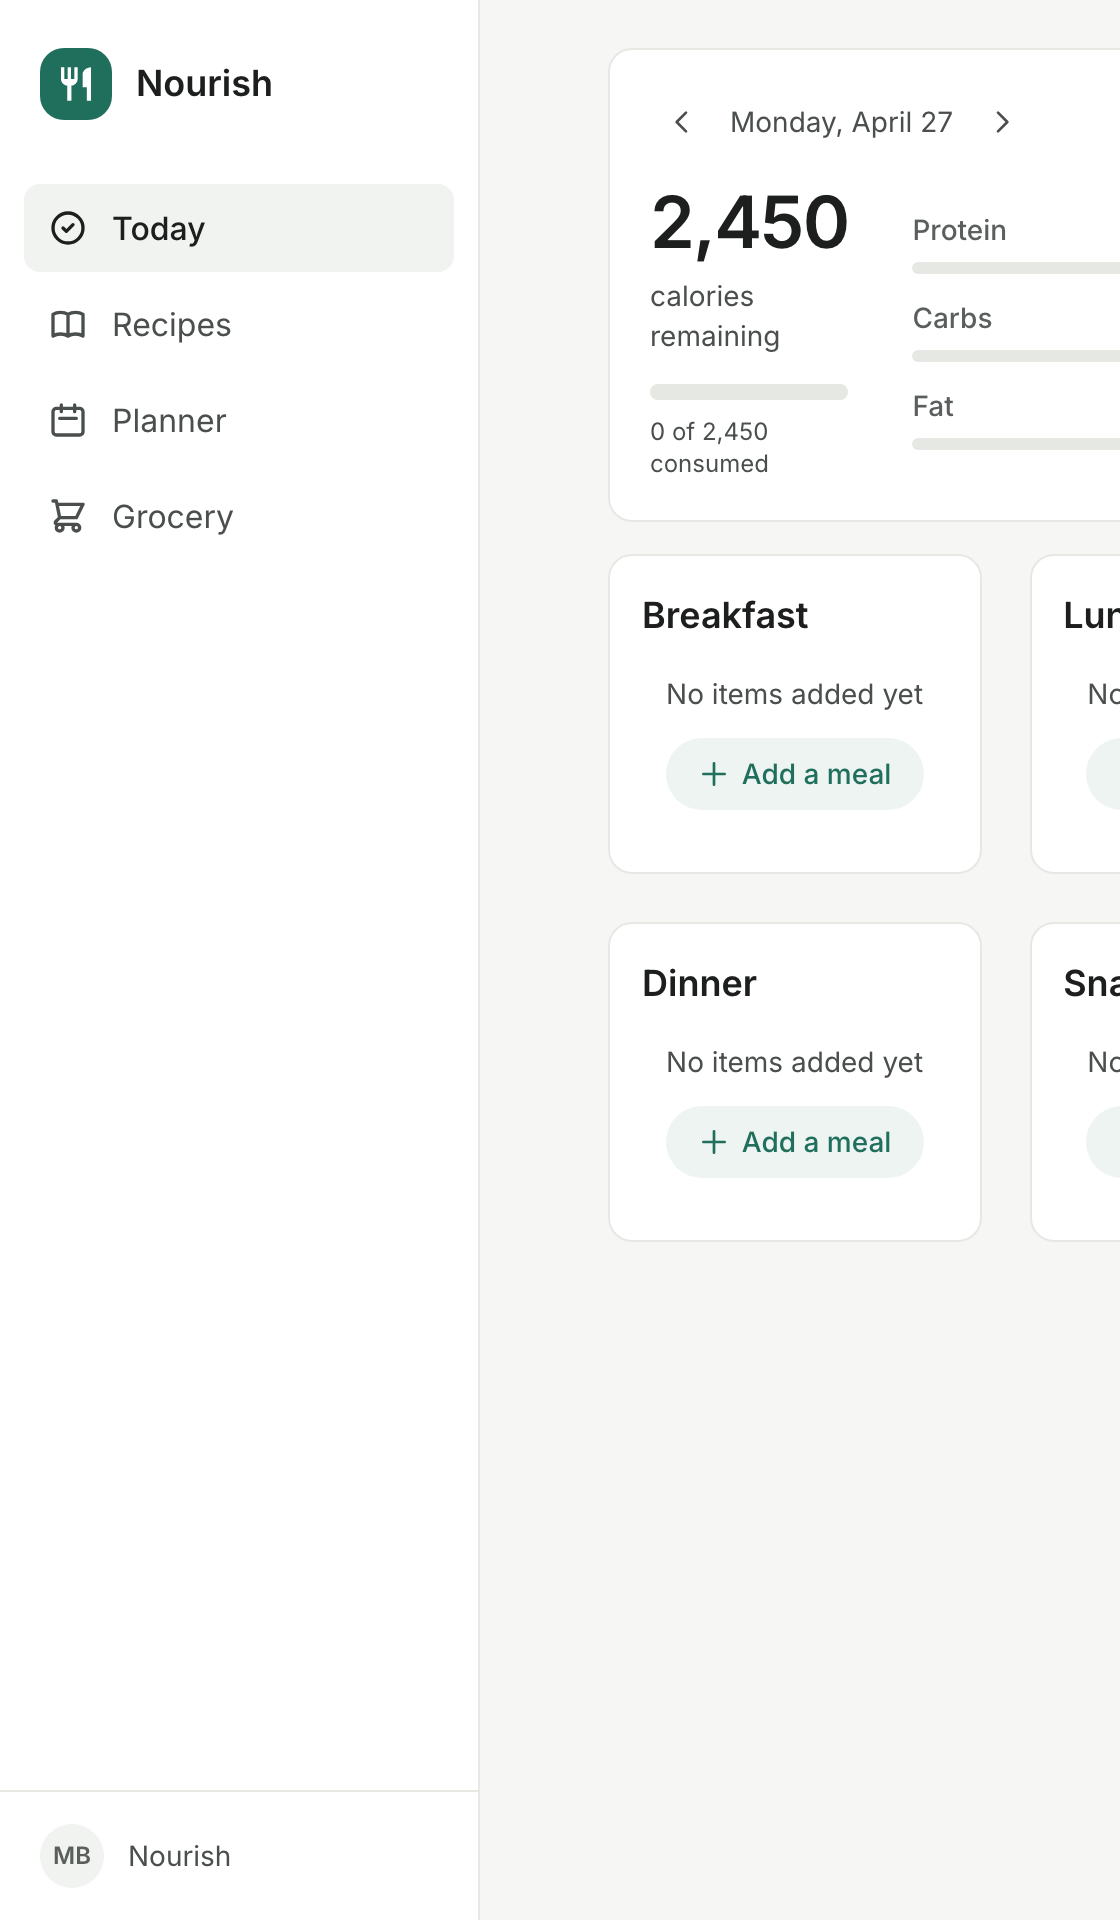
Daily Macro Tracking
Hero dashboard showing calories remaining with protein, carb, and fat breakdown against configurable daily targets. Per-meal logging via USDA and Open Food Facts databases with 100g-based nutrition data.
USDA APIOpen Food FactsNutrition Data
03
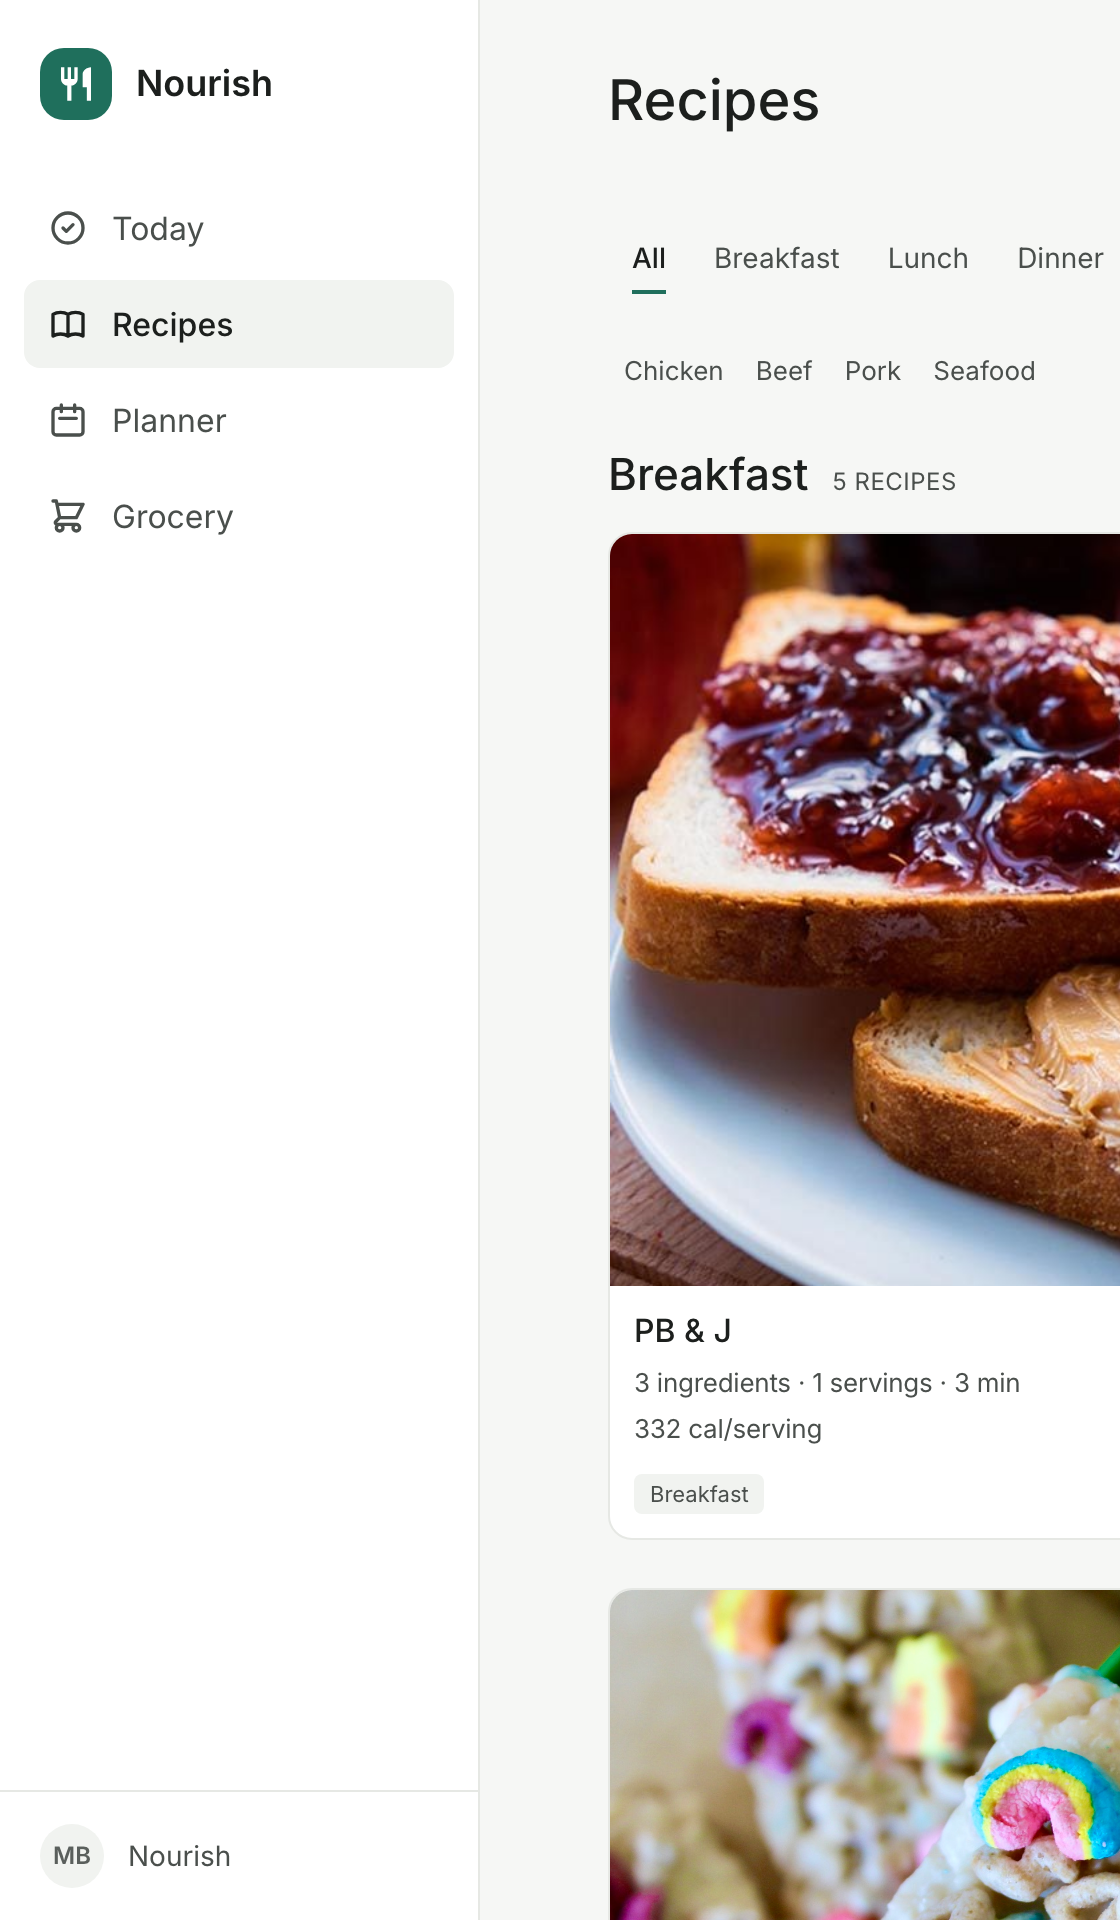
Recipe Import & Management
Three import paths: URL scraping with JSON-LD extraction, bulk text paste with automatic parsing, or manual field entry. Custom ingredient parser handles unit normalization across measurement systems.
URL ScrapingIngredient ParsingUnit Conversion
04
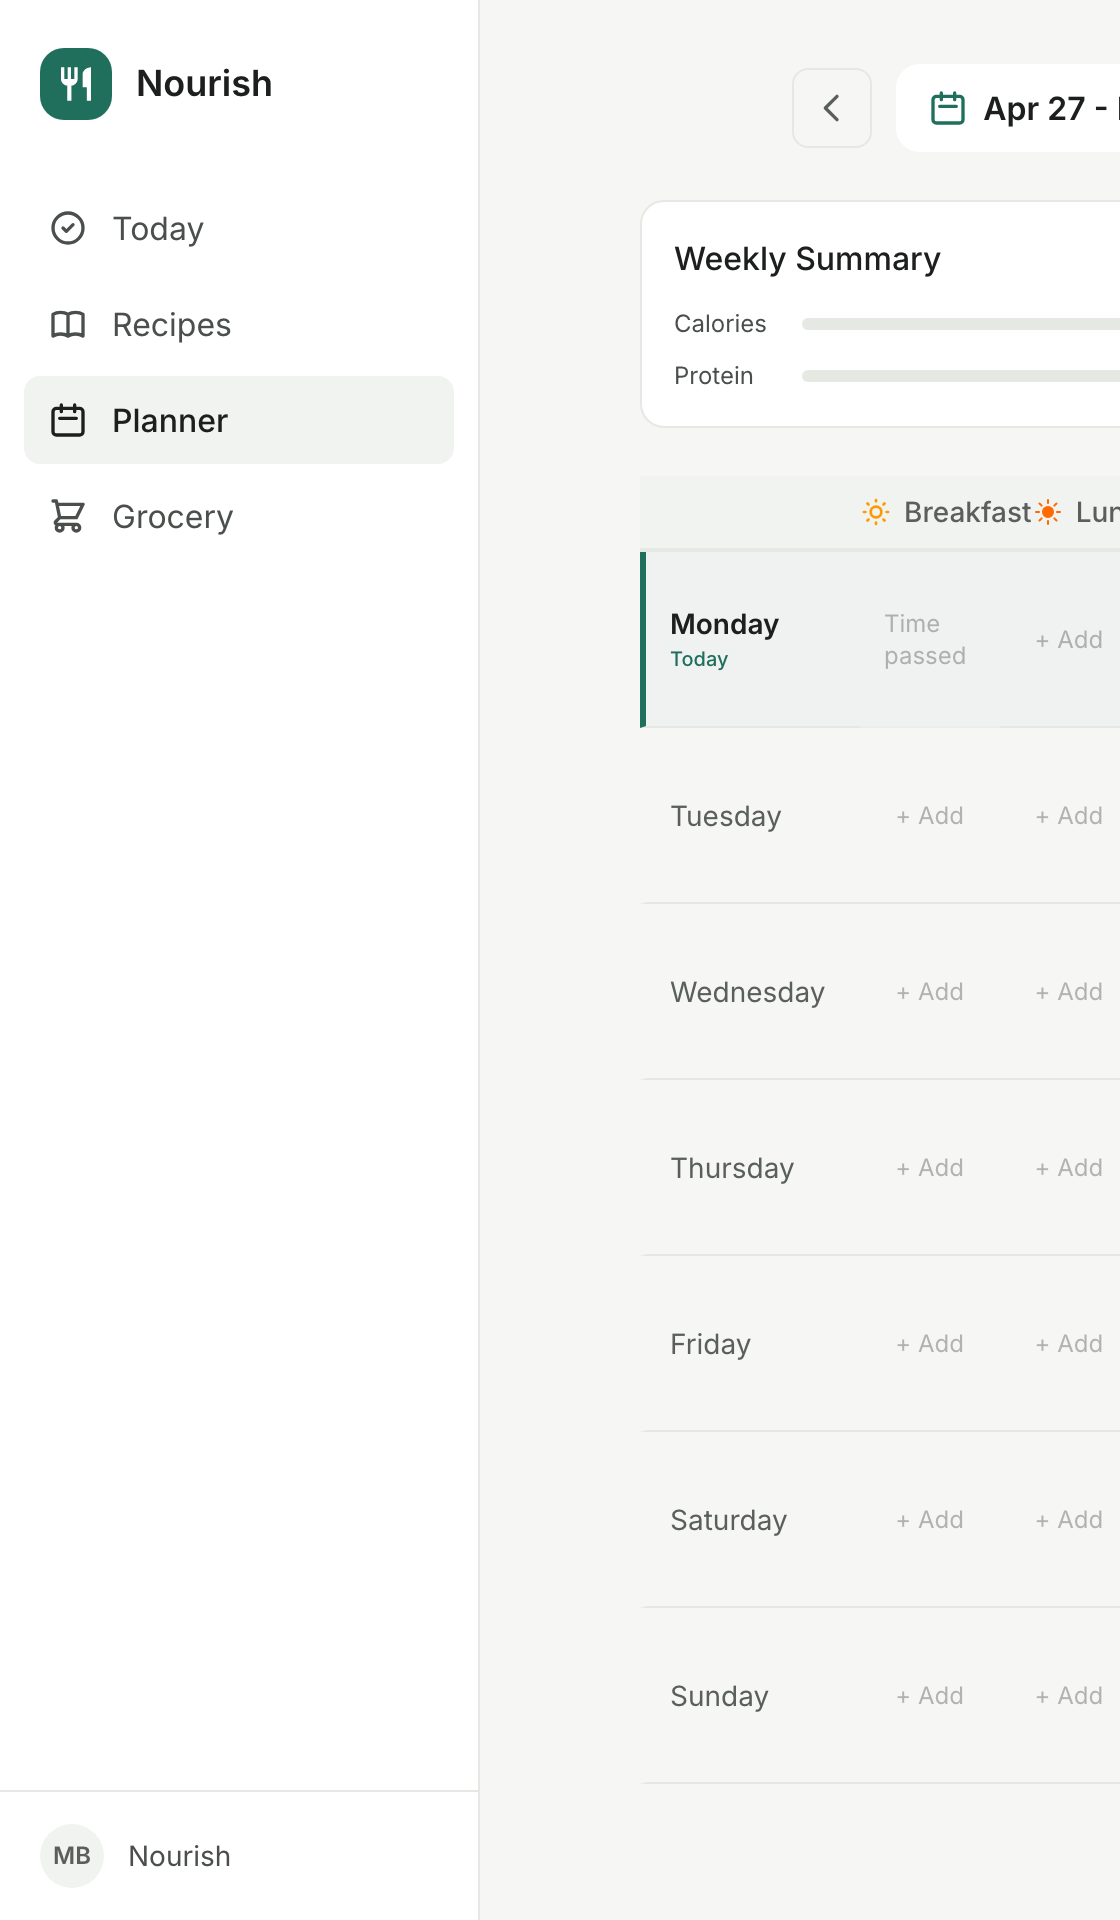
Weekly Planner & Grocery Lists
7-day calendar with per-meal slots showing recipe images and per-serving macros. Grocery lists auto-aggregate ingredients across planned meals, grouped by store aisle, with check-off and clipboard copy.
AggregationCategory GroupingMulti-Week
05
Cook Mode
Full-screen step-by-step view with auto-detected timers, ingredient highlighting per step, keyboard and swipe navigation, and wake lock to keep the screen on. Designed for hands-free use at the counter.